


Summary
After more than a half-century of leading efforts to lower international trade barriers, the United States enacted several waves of tariff increases on specific products and countries in 2018 and 2019. Overall, the U.S. implemented tariffs on 17.6% of its 2017 imports, primarily from China, raising tariffs on targeted imports from an average of 3.7% to an average of 25.8%. Trade partners retaliated by targeting 8.7% of U.S. exports, raising tariffs from an average of 8.7% to an average of 20.8%. This episode is the largest return to protectionism by the U.S. since the 1930 Smoot-Hawley Act (Irwin, 1998).
Two recent papers look at U.S. trade and tariff data up to September 2019 to estimate the impact of the trade war (Fajgelbaum et al., 2020; Fajgelbaum et al., 2020b). In the first step of their analysis, they use an event-study framework to assess the trajectory of targeted imported and exported varieties relative to those that were non targeted. They find that the price and volumes of these two groups exhibited similar trends prior to the trade war, that there was little anticipatory effect in the months leading up to tariff imposition, and that tariff increases had immediate, significant, and enduring effects. The costs of U.S. tariffs appear to be paid by U.S. importers (there is a complete pass-through of tariffs to duty-inclusive prices), and there is no evidence that U.S. exporters lowered before-duty unit values to retaliating countries relative to other countries.
The second step of the analysis is to estimate the aggregate and distributional consequences of the trade war. The authors estimate that the real annual income loss to U.S. consumers and firms who buy imports is US114.2 billion, or 0.61% of GDP. U.S. producers gain US$24.3 billion annually (0.13% of GDP) as a result of increased demand for domestically produced products, and the U.S. government collects an additional US$65 billion (0.35% of GDP) in tariff revenue. This amounts to substantial redistribution from buyers of foreign goods to U.S. producers and the government, and a modest net loss for the U.S economy as a whole.
The relatively small aggregate effect masks heterogeneous impacts across regions; the first wave of import tariffs provided the most protection to sectors that tend to be geographically concentrated in Rust Belt states, while foreign countries targeted the first wave of their retaliations on agriculture sectors primarily located in Midwestern and Mountain states. Plotting changes in import tariff exposure against the 2016 presidential vote share at the county level suggests that U.S. tariffs may have protected politically competitive counties, whereas retaliations targeted heavily Republican counties. As a result, it appears that Republican counties have been most negatively affected by the trade war.
Main article
The 2018–2019 tariff increases represent the largest return to protectionism by the U.S. in the post-war era. A recent study estimates the impact of this trade war, and finds an immediate, significant, and enduring effect on the price and volume of targeted imports and exports. Overall, there was a substantial redistribution from buyers of foreign goods to U.S. producers and the government, and a modest net loss for the U.S economy as a whole. The impact differed considerably by region, however, and Republican counties were the most negatively affected; it appears that U.S. tariffs protected politically competitive counties, whereas retaliations targeted those with a large GOP vote share.
After more than a half-century of leading efforts to lower international trade barriers, the United States enacted several waves of tariff increases on specific products and countries in 2018 and 2019. Overall, the U.S. implemented tariffs on 17.6% of its 2017 imports, primarily from China, raising tariffs on targeted imports from an average of 3.7% to an average of 25.8%. Trade partners retaliated by targeting 8.7% of U.S. exports, raising tariffs from an average of 8.7% to an average of 20.8%. This episode is the largest return to protectionism by the U.S. since the 1930 Smoot-Hawley Act (Irwin, 1998).
In our original paper, we used U.S. trade and tariff data up to April 2019 to estimate the impact of the trade war (Fajgelbaum et al., 2020). An update of this work extends the welfare analysis to include the tariff waves through September 2019 (Fajgelbaum et al., 2020b).
The tariffs had immediate and enduring effects on the price and volume of targeted varieties
There are two steps involved in estimating the impact of the trade war. The first is to document the impact of the tariffs. We use an event-study framework that tracks monthly U.S. import data to assess the trajectory of targeted imported and exported varieties relative to non-targeted varieties (varieties are defined as 10-digit product code-country pairs). Tracking volume and price trends before the tariff is necessary to demonstrate that the tariffs from the trade war can be used as a source of identifying variation. The event study analysis can also show potential anticipatory effects.
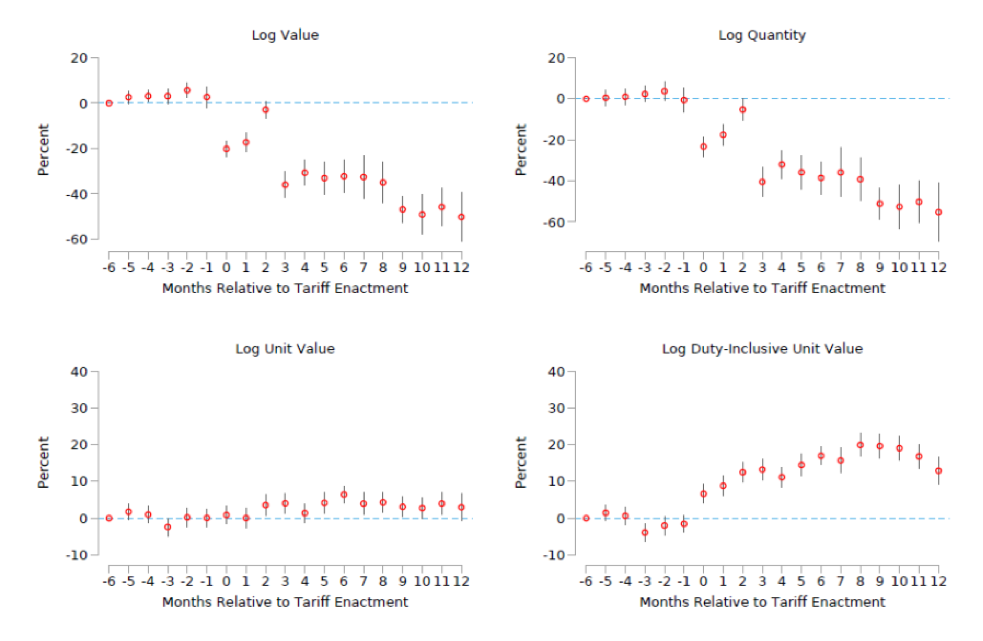
The results of the import event study, which are laid out in Figure 1, reveal four important results. First, prior to the trade war, the value and quantity of targeted and non-targeted varieties exhibited similar trends. Second, anticipatory effects are quantitatively small, implying that importers did not shift purchases forward. [1] Third, tariff increases have immediate and significant effects, which have endured—and indeed strengthened—in the medium term; 12 months after the tariffs were enacted, import volumes of targeted varieties had fallen by approximately 60% compared to non-targeted varieties. Finally, there is a complete pass-through of tariffs to duty-inclusive prices (i.e., before-duty prices do not fall), implying that the costs of U.S. tariffs are paid by U.S. importers. These pass-through results are consistent with Amiti et al. (2019, 2020) and Cavallo et al. (forthcoming), which also find complete tariff pass-through to border prices in this trade war.
Figure 1: Import Event Study
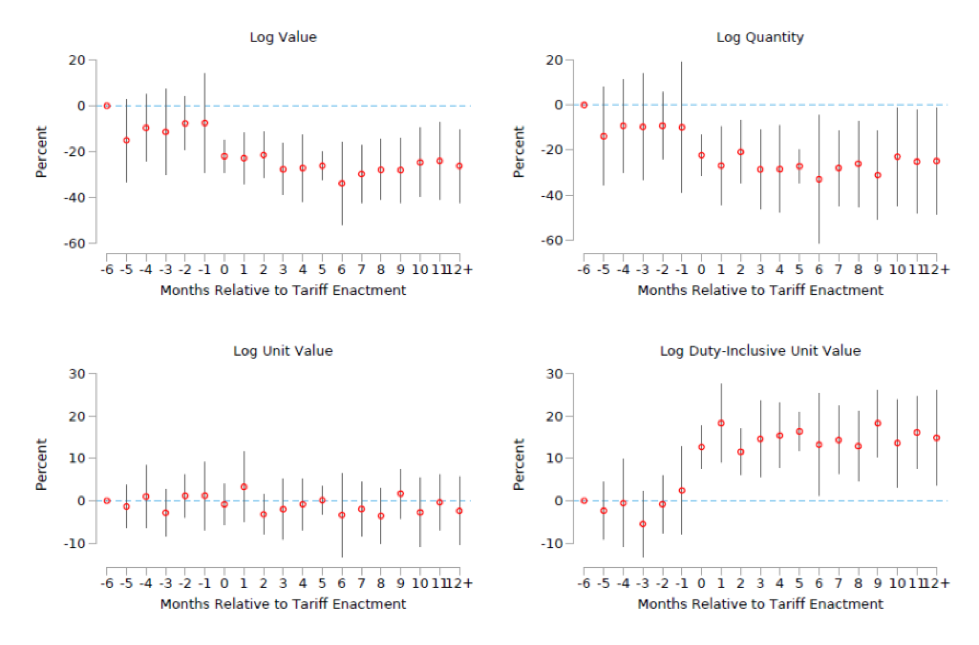
An analogous event study for U.S. exports examines the impacts of the retaliatory tariffs (Figure 2). Similar to the import results, it appears the value and quantity of targeted and non-targeted varieties exhibited similar trends prior to the tariffs, and there is no evidence of anticipatory behavior. Upon implementation of the retaliatory tariffs, U.S. exports fall sharply. We do not observe U.S. exporters lowering before-duty unit values to retaliating countries relative to other countries.
Figure 2: Export Event Study
On aggregate, the trade war has led to significant redistribution, with a modest net loss to the economy as a whole
The second step in our analysis is to estimate the aggregate and distributional consequences of the Trade war using a standard model of trade. In the model, tariffs propagate through the economy through three well-known channels:
- Tariffs raise the cost of imported goods, making U.S. consumers worse off.
- Consumers switch towards domestically produced goods, making U.S. producers better off.
- The government collects tariff revenue, which is redistributed back to its citizens.
The magnitude of each channel depends upon key demand and supply elasticities. For example, if the products on which tariffs were raised are highly substitutable with products not affected by tariff increases, then the adverse impact of the tariffs on consumers will be comparatively small.
We use the tariff variation to estimate the structural demand and supply elasticities. If changes in tariffs are uncorrelated with contemporaneous demand and supply shocks—a crucial assumption validated by the event studies and pre-trends checks—it turns out that a single tariff can be used to simultaneously instrument boththe import demand and foreign export supply curves (Romalis, 2007; Zoutman et al., 2018). Using this approach, we can obtain import demand and export supply elasticities at the variety level. We can further estimate the substitution elasticities between imported products, and between imports and domestic goods.
Our structural estimation cannot reject a perfectly horizontal foreign supply curve. Intuitively, what this means is that the full incidence of the tariff is borne by the importers.[2] Since the structural estimates imply complete pass-through of tariffs to duty-inclusive import prices, the resulting real income loss to U.S. consumers and firms who buy imports is straightforward to compute: it is the product of the import share of GDP (15%), the fraction of U.S. imports targeted by tariff increases (18%), and the average increase in tariffs among targeted varieties (22%). The annualized real income loss is therefore US$114.2 billion, or 0.61% of GDP.
Computing the impact on producers—the second channel by which tariffs propagate throughout the economy—requires additional assumptions on the supply-side of the model. We impose upward-sloping supply curves in U.S. sectors and assume perfect competition, flexible prices, and immobile labor across U.S. counties (given that this is a short-run model). When the U.S. imposes tariffs on imports, the demand for domestically produced products increases. The extent of this increase depends on how substitutable U.S. products are with imported goods, which we estimate. The demand increase raises prices for U.S. producers and exporters and confers a terms-of-trade gain for the economy. However, these gains are mitigated by the retaliatory tariffs imposed by China, which reduce the demand for U.S. goods (again, a parameter we estimate from the tariff variation). On net, we estimate that U.S. producers gained US$24.3 billion (0.13% of GDP) from the trade war. The gain would have been US$31.8 billion (0.17% of GDP) had foreign trade partners not imposed retaliatory tariffs.
Finally, the third channel—tariff revenue collected by the government—is simulated through the model, which accounts for general equilibrium impacts on expenditures. We find that the U.S. government collected US$65 billion (0.35% of GDP) in additional tariff revenue.
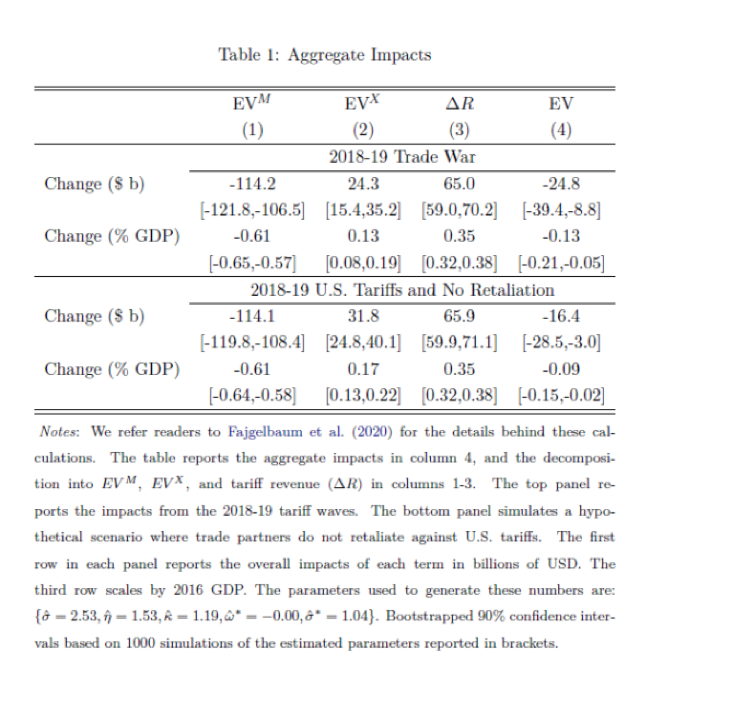
The results of the counterfactuals are summarized below (Table 1). The table reveals substantial redistribution from buyers of foreign goods to U.S. producers and the government, and a modest net loss for the U.S economy as a whole. The results strongly indicate large consumer losses from the trade war. The model can also be used to simulate what would have happened in the absence of retaliation, in which case the gains to U.S. producers would have been even larger and the economy would have experienced a smaller net loss of 0.09% of GDP.
Regional Consequences, Structure of Protection and Electoral Incentives
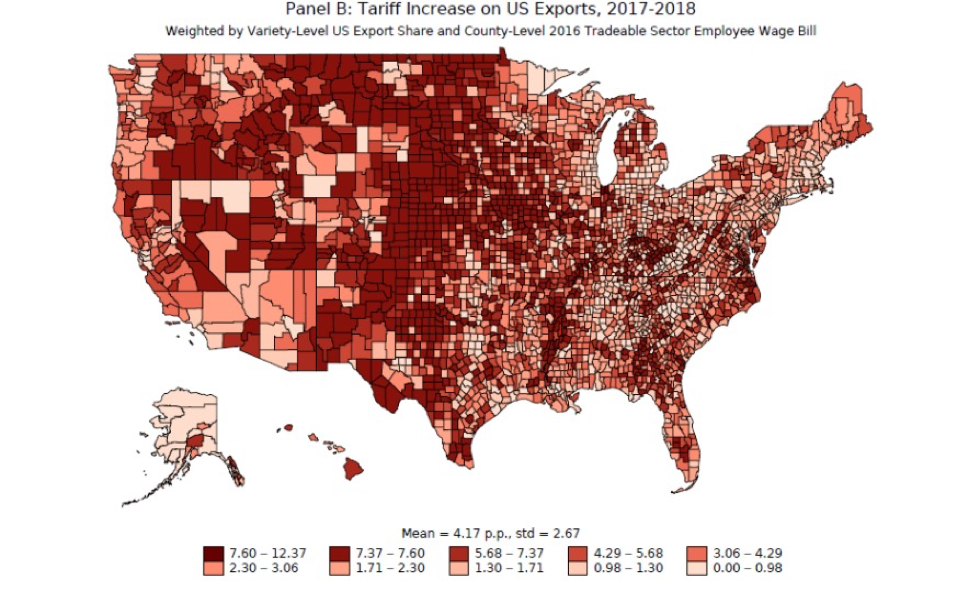
The relatively small aggregate effect masks heterogeneous impacts across regions. Figure 3 [3] shows that the first wave of import tariffs provided the most protection to sectors that tend to be geographically concentrated in Rust Belt states like Michigan, Ohio, and Pennsylvania. By contrast, foreign countries targeted the first wave of their retaliations on agriculture sectors primarily located in Midwestern and Mountain states such as Iowa, Kansas, Idaho, and North and South Dakota (Figure 4).
Figure 3: Import Tariff Exposure in U.S. Counties
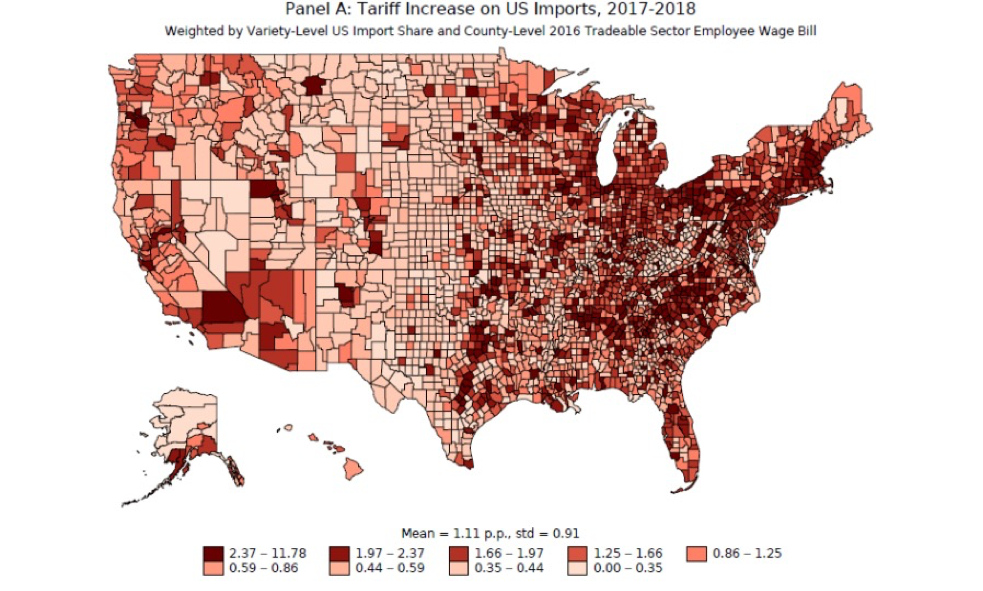
Figure 4: Export Tariff Exposure in U.S. Counties
If workers are regionally immobile, this regional heterogeneity generates distributional impacts. Model-based computations suggest a standard deviation of real wages in the tradeable sectors across counties of 0.5%, relative to an average real wage decrease of 1%.
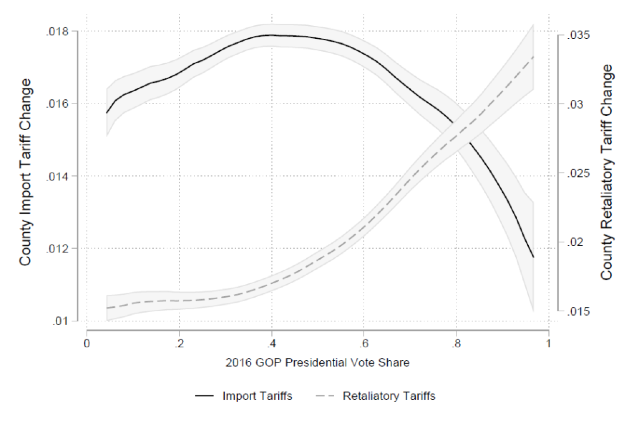
Why did the U.S. target some sectors for import protection but not others? One hypothesis is that the structure of protection was motivated by electoral incentives. Figure 5 plots changes in import tariff exposure against the 2016 GOP presidential vote share at the county level. The figure provides suggestive evidence that the U.S. tariffs may have aimed to protect electorally competitive counties with a 40–60% GOP vote share. Foreign countries, on the other hand, targeted rural, agriculture counties that voted strongly in favor of the GOP in 2016.
Figure 5: Tariff Exposure vs. GOP Vote Share
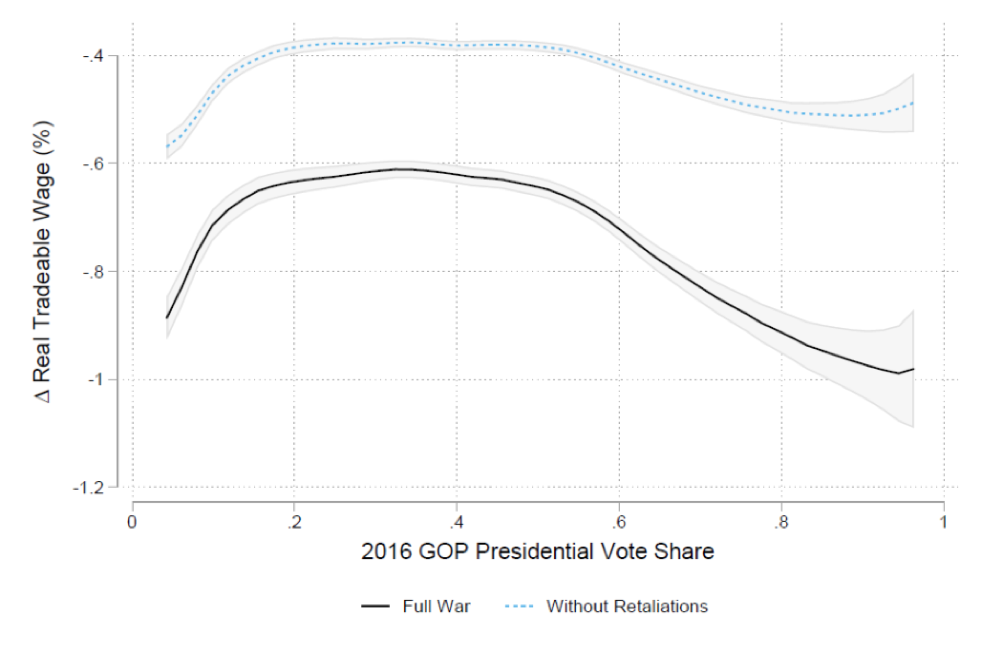
As a result of these retaliations, it seems that very Republican counties are hit hardest by the trade war. The welfare losses in a heavily Republican county (i.e., those with a 85–95% GOP vote share) are, on average, 32% larger than those in a heavily Democratic county (i.e., those with a 5–15% GOP vote share), as shown in Figure 6. Consistent with these results, Blanchard, Bown and Chor (2019) report that Republican candidates lost support in counties more exposed to trade retaliation in the 2018 congressional election, but saw no significant gains from US tariff protection.
6: Real Tradable Wage Loss vs. GOP Vote Share
Conclusion
This research aims to help scholars and policymakers understand the short-run effects of the trade war on the U.S. economy. The analysis does not consider the impacts of the trade war on economic uncertainty, productivity, and innovation, or on long-run economic outcomes. Future research in these areas would provide a valuable complement to this study and to ongoing debates about optimal trade policy.
This article summarizes ‘The Return to Protectionism’ by Pablo D. Fajgelbaum, Penny Goldberg, Patrick Kennedy, and Amit K. Khandelwal, published in The Quarterly Journal of Economics in February 2020.
Pablo D. Fajgelbaum is at Princeton University and NBER. Penny Goldberg is at Yale University, CEPR and NBER. Patrick Kennedy is at the University of California, Berkeley. Amit K. Khandelwal is at Columbia University and NBER.
[1] The lack of pre-trends and anticipatory effects is confirmed by looking at correlations between changes in outcomes during the trade war and previous changes in tariffs and at dynamic specifications with leads and lags.
[2] Our estimation controls for country- time and product-time effects, and therefore is unable to capture import price declines due to relative wage changes across countries or sectors. In other words, the results do not imply that the U.S. is a small open economy unable to affect world prices, as terms-of-trade effects could have occurred through wage adjustments at the country-sector level.
[3] Figures 3-6 are from Fajgelbaum et al. (2020) and are based on tariff data up to April 2019.