Summary
The 2009 Credit CARD Act barred credit card lenders in the United States from raising interest rates on existing borrowers in response to new information. Combining customer account data covering the majority of U.S. credit card balances with a structural model of the credit card market, this study finds that the Act’s price restrictions raised consumer welfare while causing some customers to reduce borrowing in response to higher rates. The relatively high profitability of pre-CARD-Act credit card lending was crucial for realizing these benefits and offsetting the costs of worsening adverse selection.
Lenders learn about their borrowers over time, and before 2009, credit card lenders in the United States acted quite freely on what they learned. An account opened at one interest rate could be repriced “at any time, for any reason,” in the stock language of pre-2009 card agreements, as a lender observed how a consumer actually used and paid off a card. The 2009 Credit CARD Act largely banned this practice of personalizing interest rates to customers’ habits. In a market where the median credit card account saw one or more personalized interest-rate adjustments per year, the Act amounted to a large-scale experiment in banning a particular kind of personalized pricing.
In “Private Information and Price Regulation in the US Credit Card Market,” Scott Nelson studies how the Act’s restrictions on pricing affected interest rates, borrowing, and consumer welfare. He shows that the Act led to lower prices for risky consumers who had a high demand for credit. However, the Act led to higher rates for relatively safe borrowers who happened to have low credit scores. Even in cases where interest rates rose, consumers benefited from the Act’s insurance value: the ability for customers to retain favorable rates when their default risk increased. On the whole, these changes led to higher consumer welfare across the credit score spectrum. These benefits were possible only because of the relatively high profitability of credit card lending before the CARD Act. If pre-existing markups had been lower, the Act’s restrictions would have led to an equilibrium with little credit card borrowing at all.
Main article
In 2007, credit card lenders in the United States provided 85 million U.S. households access to over $3 trillion in credit lines. The majority of credit card holders borrowed on at least one credit card, despite paying interest rates that averaged around 15% (Board of Governors of the Federal Reserve System, 2025; Bricker et al., 2012). After several waves of deregulation from the 1970s through the 1990s, Congress passed in 2009 the Credit Card Accountability Responsibility and Disclosure (CARD) Act, which has arguably been the most substantial expansion in credit card regulation to date. While the Act contained other provisions, including some that have been studied in important prior work (Agarwal et al., 2015; Debbaut et al., 2016; Han et al., 2018; Keys and Wang, 2019), the Act’s restriction on interest rate increases was seen by industry commentators as “the core, most important provision of the CARD Act” (American Bankers Association, 2013).
The market implications of this restriction hinge on how the Act, in practice, limits the pricing of two distinct types of information. First, the CARD Act constrains lenders’ ability to adjust prices based on information about consumer default risk. Because the credit card market is adversely selected – that is, the most credit-hungry consumers also tend to be the riskiest ones – restrictions on pricing this risk can lead the market to “unravel” for relatively low-risk consumers, just as unpriced information leads to a market for lemons in Akerlof’s (1970) analysis of used car sales. (When used-car buyers lack information about which used cars operate well and which do not, used-car buyers will pay less for a good car than the seller is willing to sell for. This leads the sellers of good cars to leave the market, leaving only “lemons” behind.)
In other words, lenders did not reprice credit just to adjust for risk. Rather, they used personalized information to extract extra profits from customers.
On the other hand, credit card lenders also learn over time about how strong a consumer’s demand for credit is. Because much of this information is not shared with credit bureaus but rather is private to a consumer’s own lender, the CARD Act’s repricing restrictions limit lenders’ ability to raise prices for relatively inelastic consumers. The net effect of the CARD Act thus reflects the competing forces of market power — sustained in part by lenders’ private information — and adverse selection.
The Credit Card Market, Before and After
The analysis begins by detailing several new facts about how the credit card market operated both before and after the CARD Act. This evidence also illustrates the dueling roles played by market power and adverse selection.
In the year before the Act took effect, 48–54% of borrowing accounts experienced a discretionary interest rate increase of the kind the Act would ban. After implementation in February 2010, the incidence of these interest rate increases dropped to nearly zero. The pricing consequences appeared quickly. Figure 1 shows the interquartile range of interest rates on mature accounts, by origination cohort, after controlling for credit score: for cohorts maturing before the CARD Act restrictions took effect, this measure of price dispersion was consistently about 7.5 percentage points; for cohorts maturing after, it fell sharply by about one-third.
Figure 1. Price Dispersion Before and After the Credit Act
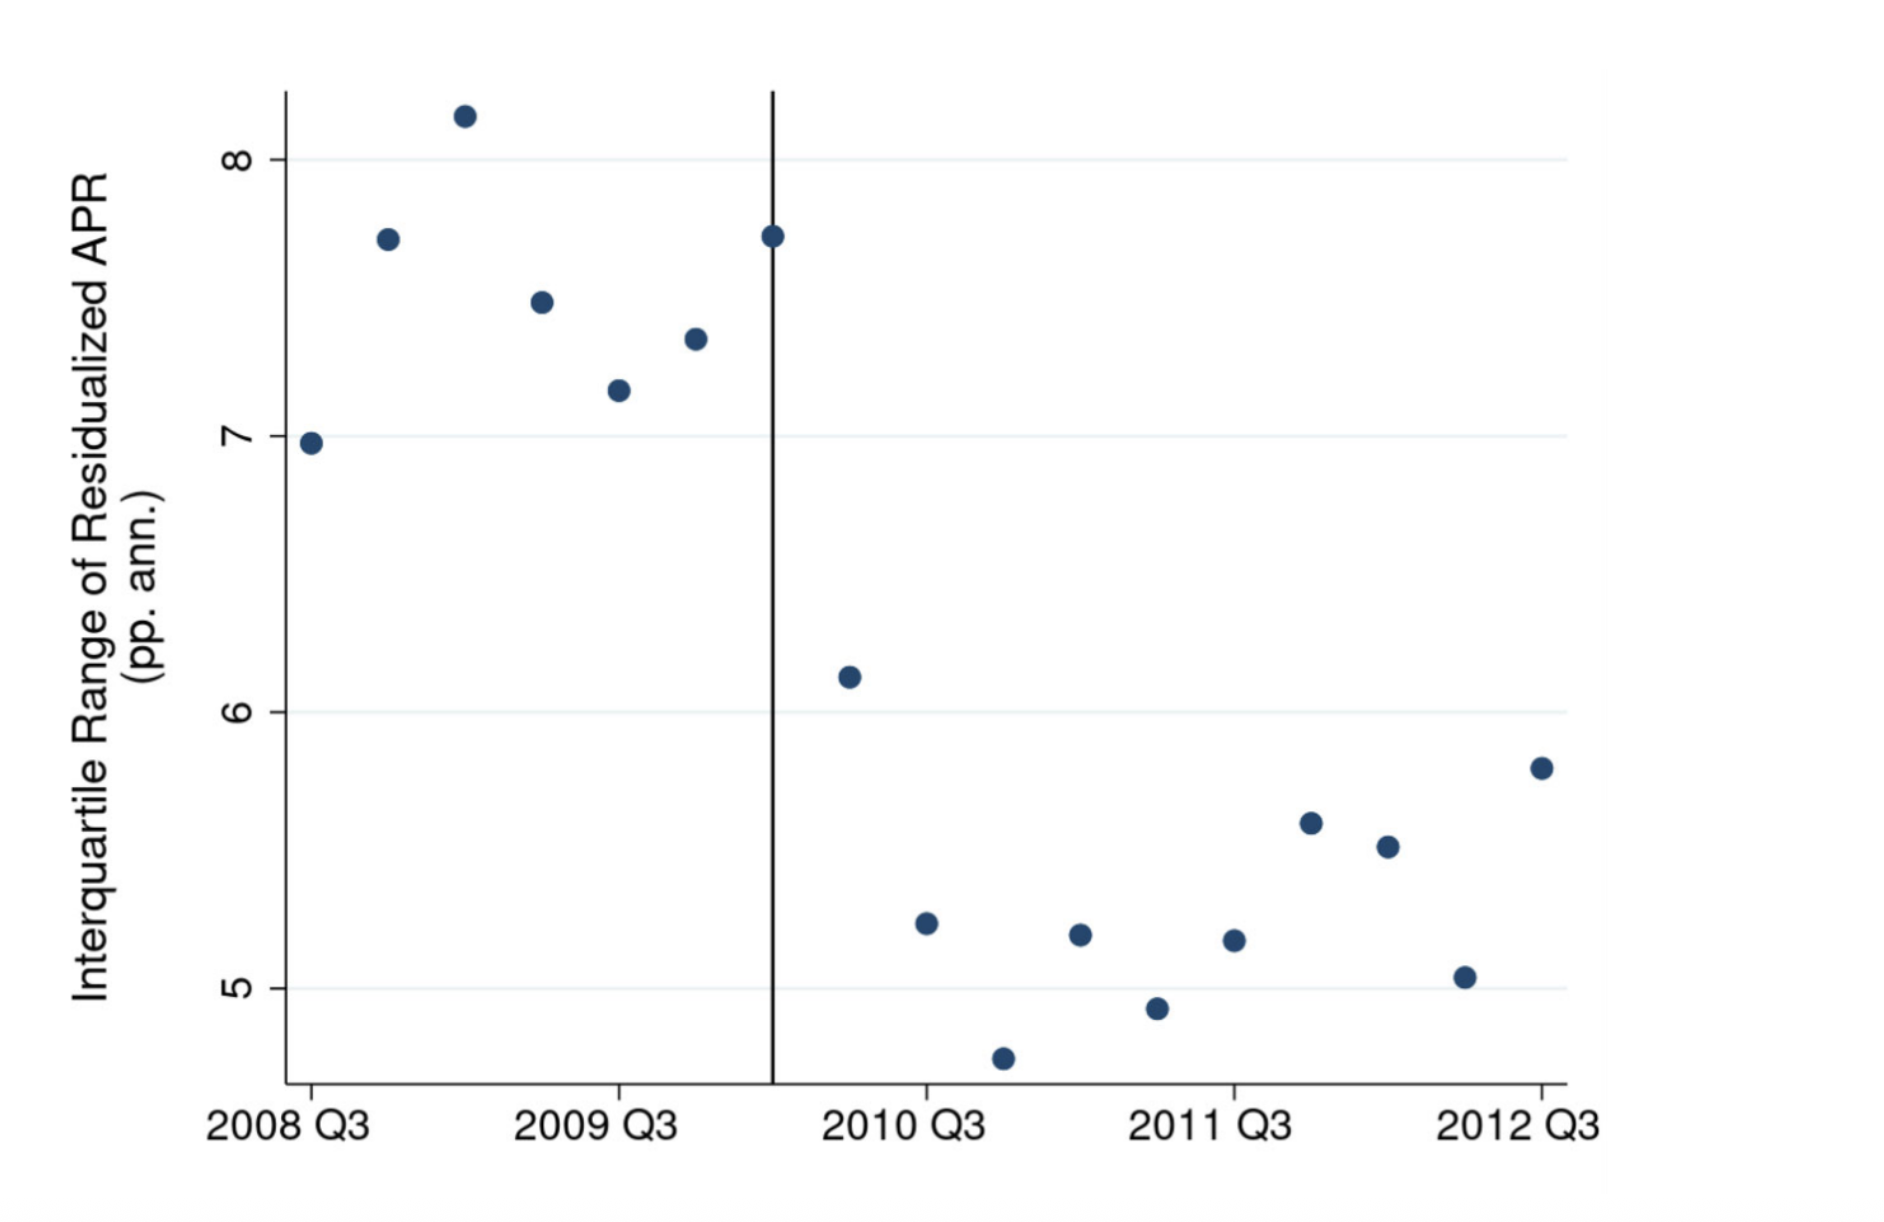
Note: The figure shows the interquartile range (IQR) of annual percentage rates on borrowing accounts by origination cohort, after partialling out origination credit score and origination month. The date shown for each cohort is at an age of 18 months, by which point introductory promotional rates have typically expired. Credit score controls are 20-point bins, and the sample is restricted to include only accounts in the same credit score bin at the date observed as at origination. The vertical black line shows the CARD Act repricing restrictions’ implementation date in February 2010.
For the least risky, the higher rates [due to the CARD Act] were sometimes more than they were willing to pay. Overall, 30% of these safer subprime borrowers left the market.
Early signs of market unraveling appeared among those who had been securing the cheapest rates. Among those with the same credit scores, the 25% of borrowers receiving the cheapest interest rates saw their rates rise over time relative to the mean. Rates rose 100 basis points relative to the mean for prime (safe) borrowers and over 200 points for subprime (risky) borrowers. Consumer exit was also concentrated in the credit score segments where the cheapest quartile of rates rose the most – suggesting that safe borrowers within each credit score segment who had received cheaper rates now lost their discounts and left the market.
On the other hand, other evidence suggests that at least some consumers benefited from the Act. Table 1 illustrates how, before the Act went into effect, when lenders observed borrowers making a small infraction such as paying a bill late by just a few days, pricing rose for the median consumer by up to 26 percentage points annualized. Lenders earned higher returns on these accounts than the baseline accounts in good-standing. Higher rates that merely covered higher expected default losses would leave returns unchanged. That lenders’ returns rose alongside risk instead suggests that lenders were using private information about their customers’ credit demand, and personalized price changes, to extract additional profits from select consumers.
Table 1. Repricing and Private Information Rents
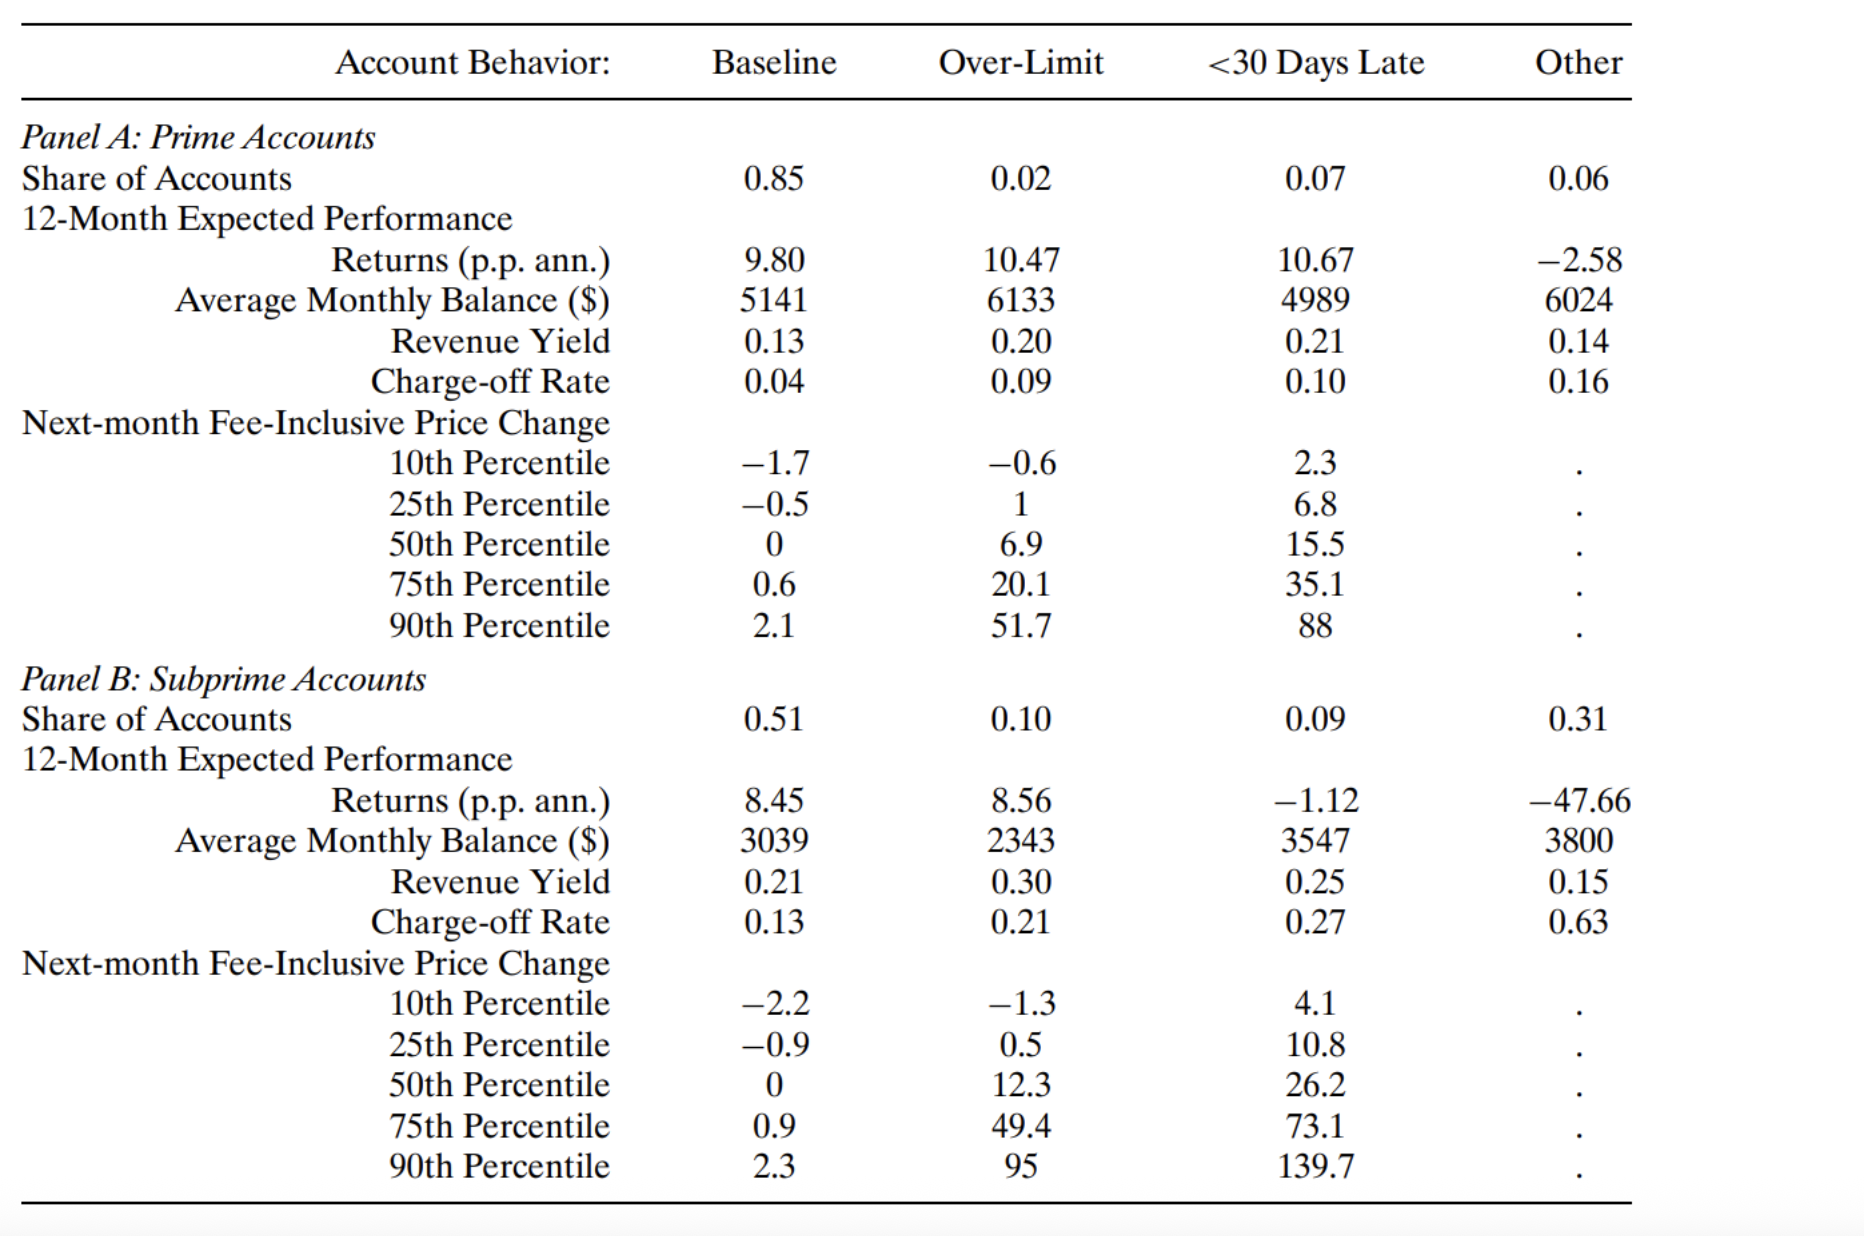
Note: The table summarizes price changes, revenues, costs, and lender returns for revolving credit card accounts that exhibit various behaviors in the pre-CARD-Act period. The first column shows accounts with “baseline” good-standing behavior, defined as no delinquency, no over-limit transactions, and no credit score change of more than 30 points relative to the prior month. The second and third columns show accounts with over-limit transactions and delinquencies of less than 30 days. The fourth column shows all accounts not included in the first three.
How Lenders Used Private Information
The next part of the analysis develops and estimates a model of the pre-CARD-Act credit card market to quantify the role such private information and to understand the CARD Act’s effects on market equilibrium. A first step in this direction is to estimate lenders’ private information about their borrowers’ hidden (i.e, not captured in credit scores) demand and risk.
As proved in the paper’s main appendix, researchers can recover how lenders identified these hidden demand and risk levels—or borrower types—based on their pricing strategies and from subsequent default rates at each interest rate level. The procedure requires two plausible assumptions. The first assumption is that defaults cannot respond to interest rates themselves. This assumption is supported empirically: quasi-experimental repricing evidence that I exploit elsewhere in the paper can reject default increases larger than 0.04 percentage points following a 100-basis point price increase. Second, lenders must never charge a riskier hidden type less — a “non-advantageous selection” condition that is supported by prior randomized-controlled trial evidence showing the market is adversely selected.
Under these assumptions, default rates are monotonically increasing in equilibrium prices within each lender and credit score, and the mapping from borrowers’ hidden types to prices can be inverted. Figure 2 illustrates this procedure in three steps: Panel (a) plots the default rates for consumers in the same credit score bin as they are charged different rates from two real lenders in the dataset, here named Bank A and Bank B. Panel (b) uses a statistical method called isotonic regression to characterize the relationship between default and prices, showing that as default rates go up, so does price. Panel (c) groups the borrowers into discrete hidden types based on default risk. If all information about demand and risk were captured by credit scores, there would in expectation be no separately identifiable borrower types within each credit score bin. In contrast, the isotonic fits explain 97.9% of observed variation in default rates within credit scores, indicating that, before the CARD Act went into effect, lenders were quite accurate in customizing pricing based on private information that credit scores did not capture.
Figure 2. Recovering Hidden Types
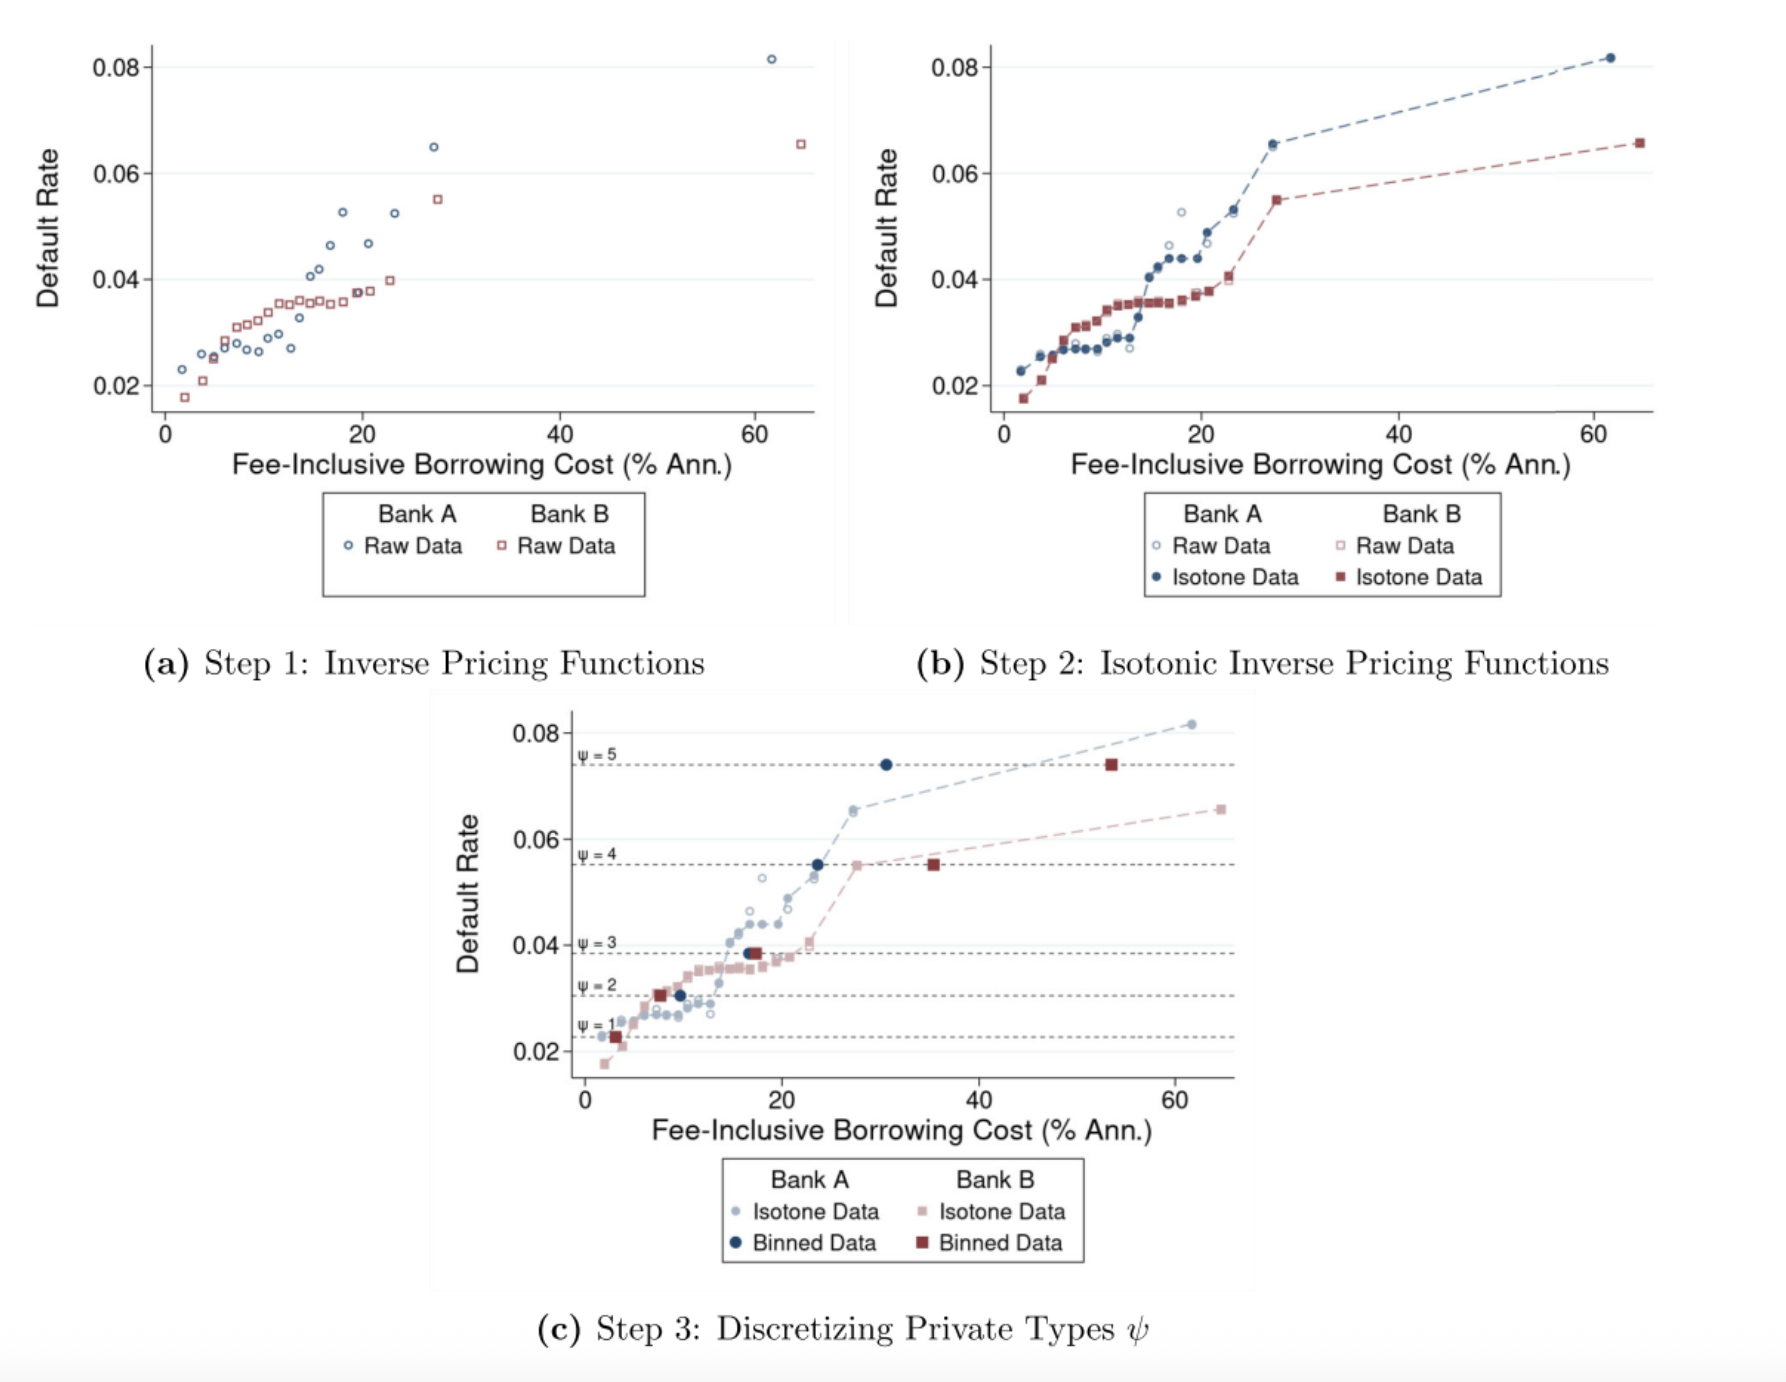
Notes: The figure illustrates the process of recovering private-information types from observed equilibrium pricing in pre-CARD-Act data. Panel (a) shows an example of raw data on default rates at quantiles of price levels on two different lenders, labeled Bank A and Bank B, for borrowers with public type corresponding to credit scores 760-779. Default is defined as delinquencies of 90+ days at any time over the subsequent 2 years. Panel (b) shows isotonic regression estimates of the relationship between default and equilibrium pricing, together with the raw data from Panel (a). Panel (c) then shows how borrowers at different quantiles of the population distribution of default rates within this credit score range are grouped into discrete private-information types that share a common default rate, but face different prices depending on their choice of lender.
…lifetime consumer welfare rises across the credit score distribution. Subprime consumers…are roughly $600 better off, and prime [and superprime] consumers are over $1,000 better off.
The exercise shows that lenders’ private information was economically important. Within a single credit score bin, the riskiest hidden type defaults at roughly twice the rate of the safest. This variability within credit score bins is comparable in magnitude to what would be implied by large movements in the credit score itself. Indeed, hidden types did predict changes in credit score: riskier borrowers were disproportionately those whose credit scores fell in subsequent periods. Knowledge about these hidden types also helped sustain substantial markups: for example, these markups exceeded 40% for the median-risk subprime borrower.
How the Act Changed Lending Practices
The paper uses its model of the credit card market to study how the CARD Act altered the behavior of lenders after they could no longer adjust prices over time – either based on their knowledge of their borrowers’ hidden types, or based on more publicly observable changes in credit score. The model features forward-looking consumers whose risk and demand evolve over time, who face costs for switching between credit card companies, and who choose among different lenders that learn their customers’ hidden types through the lending relationship. The analysis estimates the model on pre-CARD-Act pricing practices and on patterns in consumer demand, and then imposes the Act’s restrictions within the model: each lender must commit, upon issuing the card, to a single, long-run interest rate (plus a permitted teaser rate) that cannot respond to anything learned about a customer afterward. This exercise isolates the effect of the CARD Act price restrictions, separately from the effect of the Great Recession and other regulatory changes that accompanied the Act.
The Act’s pricing restrictions led to price decreases for most consumers, but not everyone. Figure 3 shows an example of partial unraveling: among deep-subprime borrowers (with credit scores from 580–599), lenders stop personalizing rates and pool everyone at a single, fee-inclusive rate that averages about 50% annualized. For the riskiest customers with the highest demand, this represented a price decrease, which encouraged them to borrow more. For the least risky, the higher rates were sometimes more than they were willing to pay. Overall, 30% of these safer subprime borrowers left the market. Because the borrowers who left the market were those facing the steepest price increases, the average price actually paid by borrowers fell across every credit score level.
Figure 3. Responses to the CARD Act Pricing Restrictions
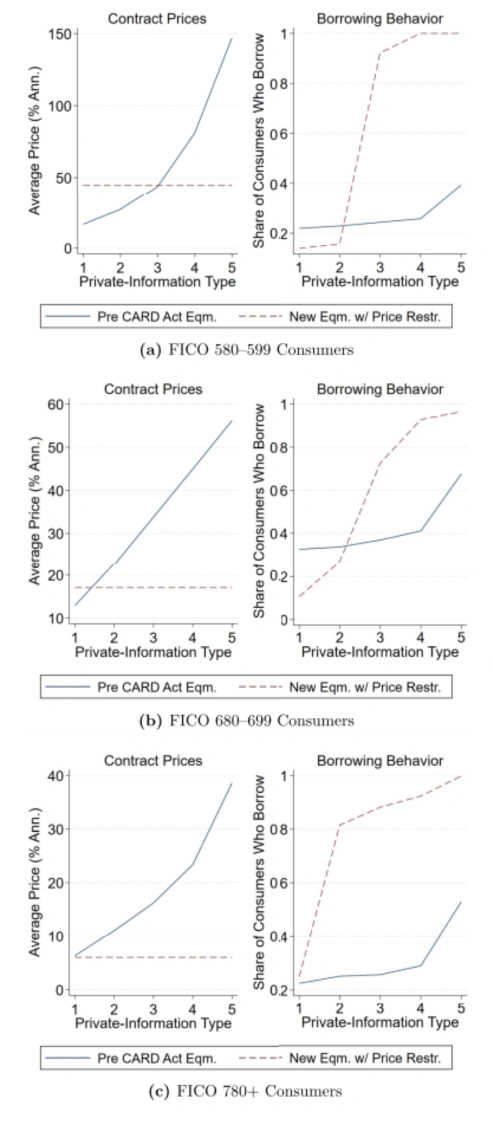
Note: The figure shows average prices and borrowing behavior for different hidden types across three categories of borrowers based on their credit score, . For each credit score bracket, in equilibrium with and without the CARD Act price restrictions.
Welfare Implications and the Act’s Implicit Insurance Value
Figure 4 shows the main consequences of the Act for consumers: lifetime consumer welfare rises across the credit score distribution. Subprime consumers (credit scores less than 660) are roughly $600 better off, and prime (credit scores between 660-720) and superprime (720+) consumers are over $1,000 better off. Total welfare rises as well, though by less, since much of the consumer gain comes from lower lender profits.
Figure 4. Consumer and Total Surplus
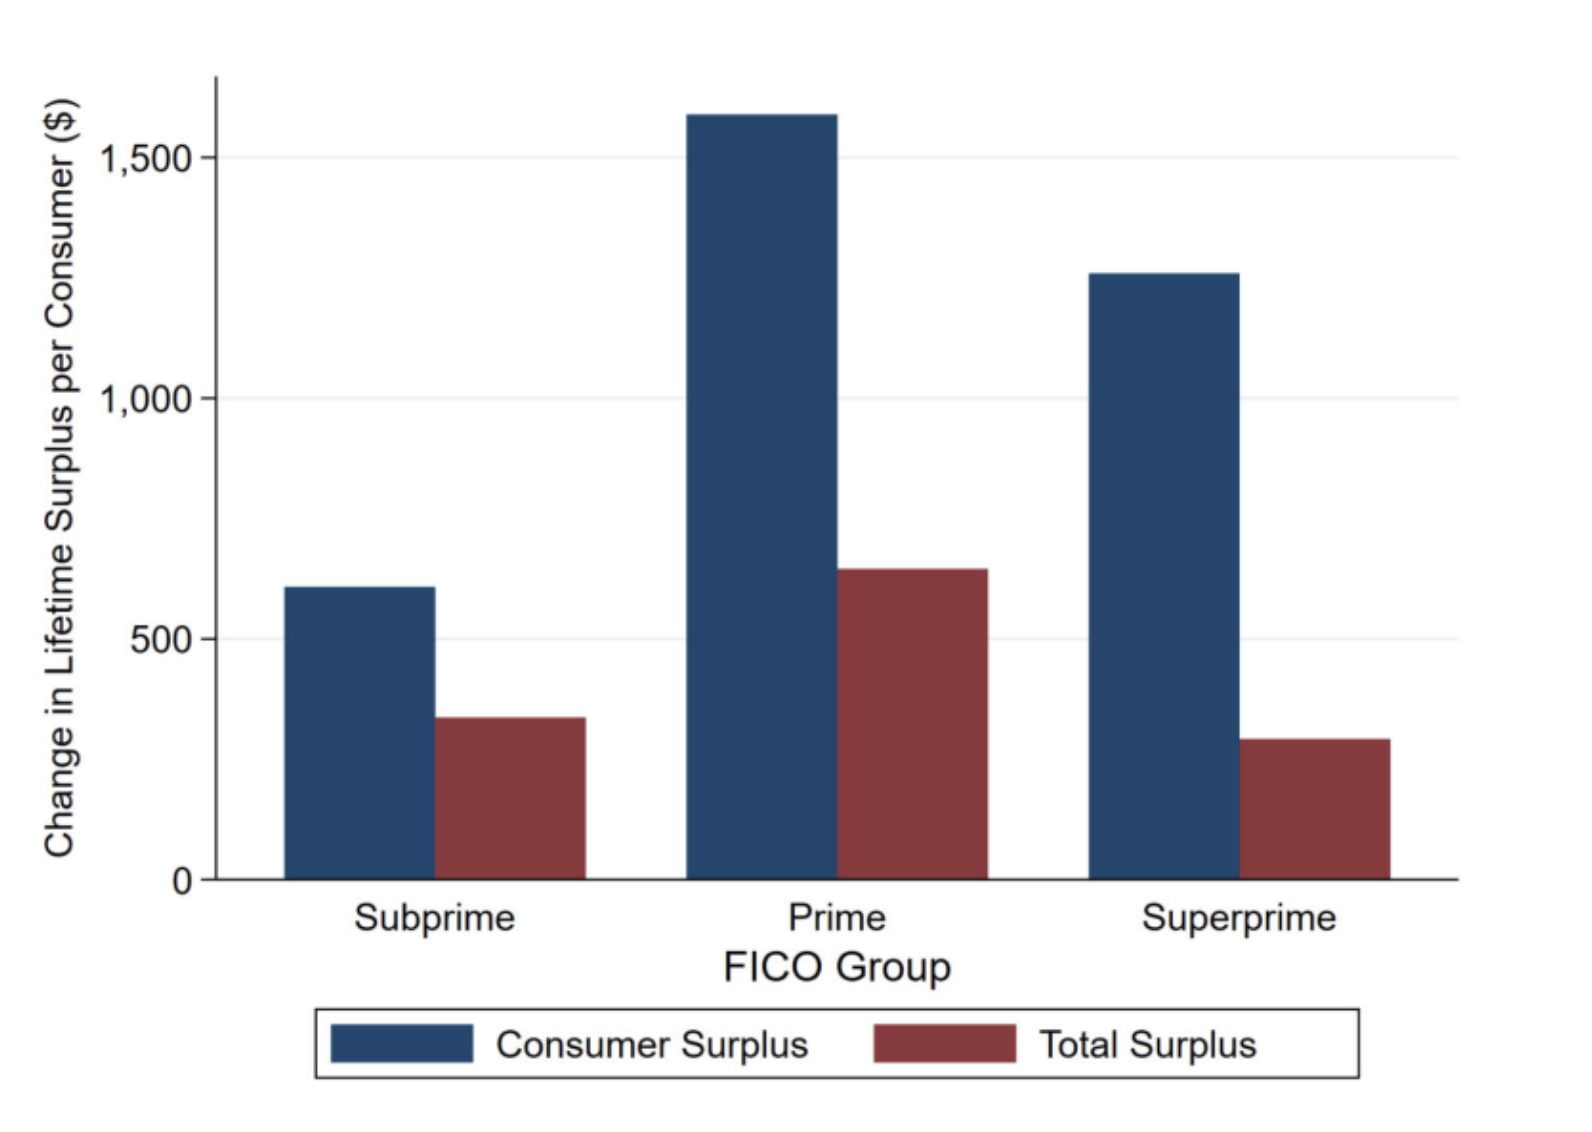
Note: The figure shows estimated changes in lifetime consumer and total surplus due to the CARD Act’s price restrictions. Total surplus is consumer surplus plus the present value of lenders’ profits.
Importantly, a key mechanism driving these gains for consumers is the Act’s implicit insurance value. Before the Act took effect, lenders repriced interest rates in response to changes in risk levels. If a borrower’s risk went up, so did their interest rate. For the borrower, this meant that interest rates were going up at the exact moment when their ability to pay higher interest rates had diminished (Cochrane, 1995; Hendel and Lizzeri, 2003; Finkelstein et al., 2005; Handel et al., 2015). By fixing contract terms upon card issuance, the Act let borrowers carry the same interest rates even when their ability to pay worsened.
Under a counterfactual that isolates the effect of changes to hidden types, I find that this implicit insurance accounts for nearly all of the welfare gains to superprime borrowers. This is because superprime borrowers are most likely to “lock in” favorable pricing before their credit scores potentially change over time.
By fixing contract terms upon card issuance, the Act let borrowers carry the same interest rates even when their ability to pay worsened.
In contrast, long-time subprime borrowers were the most exposed to the costs of unraveling, as increases in rates concentrated among these borrowers, pushing out the least risky of them who once had favorable rates. Relative to prior work that has highlighted how personalized pricing shapes markups (Fudenberg and Villas-Boas, 2007; Grunewald et al., 2023; Dubé and Misra, 2023; Rhodes and Zhou, 2024; Buchholz et al., 2025), this finding emphasizes how restrictions on personalized pricing can also create substantial insurance value in markets where consumers’ types change over time.
Even when considering the value borrowers received from this implicit insurance, the CARD Act’s improvement to consumer surplus relied crucially on the high level of pre-existing markups. In a counterfactual in which pre-CARD-Act prices equaled the marginal costs of lending to borrowers (i.e., in which markups were zero), the Act’s repricing restrictions would have caused the market to unravel almost completely. Prices would exceed 150% annualized at all credit scores, and borrowing would nearly cease. In this sense, information regulation such as that in the CARD Act can be a compelling pro-competitive tool, but the design of effective policy relies on understanding how firms use such information to tailor pricing to both demand and cost.
Nelson, Scott T. “Private Information and Price Regulation in the US Credit Card Market.” Econometrica 93, no. 4 (2025): 1371-1410.
References
Agarwal, Sumit, Souphala Chomsisengphet, Neale Mahoney, and Johannes Stroebel. 2015. “Regulating Consumer Financial Products: Evidence from Credit Cards.” The Quarterly Journal of Economics 130, no.1 (Nov): 111–164. https://doi.org/10.1093/qje/qju037.
Akerlof, George A. 1970. “The Market For ‘Lemons’: Quality Uncertainty And The Market Mechanism.” The Quarterly Journal of Economics 84, no.3 (Aug): 488–500. https://doi.org/10.2307/1879431.
American Bankers Association. (2013, February). Response to notice and request for information regarding the credit card market (Comment submitted to the Consumer Financial Protection Bureau, Docket No. CFPB-2012-0048).
Board of Governors of the Federal Reserve System (US). 2025. Commercial bank interest rate on credit card plans, accounts assessed interest (TERMCBCCINTNS) [Data set]. FRED, Federal Reserve Bank of St. Louis. https://fred.stlouisfed.org/series/TERMCBCCINTNS.
Bricker, Jesse, Arthur B. Kennickell, Kevin B. Moore, and John Sabelhaus. 2012. “Changes in U.S. Family Finances from 2007 to 2010: Evidence from the Survey of Consumer Finances.” Federal Reserve Bulletin 98, no.2 (June): 1–80. https://www.federalreserve.gov/pubs/bulletin/2012/pdf/scf12.pdf.
Buchholz, Nicholas, Laura Doval, Jakub Kastl, Filip Matejka, and Tobias Salz. 2025. “Personalized Pricing and the Value of Time: Evidence from Auctioned Cab Rides.” Econometrica 93, no.3 (May): 929–958. https://doi.org/10.3982/ECTA18838.
Cochrane, John H. 1995. “Time-Consistent Health Insurance.” Journal of Political Economy 103, no.3 (June): 445–473. https://doi.org/10.1086/261991.
Debbaut, Peter, Andra C. Ghent, and Marianna Kudlyak. 2016. “The CARD Act and Young Borrowers: The Effects and the Affected.” Journal of Money, Credit and Banking 4, no.7 (Oct):1495–1513. https://doi.org/10.1111/jmcb.12340.
Dubé, Jean-Pierre and Sanjog Misra. 2023. “Personalized Pricing and Consumer Welfare.” Journal of Political Economy 131 no.1 (Jan): 131–189. https://doi.org/10.1086/720793.
Finkelstein Amy, Kathleen McGarry, and Amir Sufi. 2005. “Dynamic Inefficiencies in Insurance Markets: Evidence from Long-Term Care Insurance.” American Economic Review 95, no.2 (May): 224–228. DOI: 10.1257/000282805774669808.
Fudenberg, Drew and J. Miguel Villas-Boas. 2007. “Behavior-Based Price Discrimination and Customer Recognition.” In T. Hendershott (Ed.), Handbook on Economics and Information Systems Volume 1 (pp.377–436). Elsevier.
Grunewald, Andreas, Jonathan Lanning, David Low, and Tobias Salz. 2023. “Auto Dealer Loan Intermediation: Consumer Behavior and Competitive Effects.” NBER Working paper. http://www.nber.org/papers/w28136.
Han, Song, Benjamin J. Keys, and Geng Li. 2018. “Unsecured Credit Supply, Credit Cycles, and Regulation.” The Review of Financial Studies 31, no.3 (Oct): 1184–1217. https://doi.org/10.1093/rfs/hhx114.
Handel, Benjamin R., Igal Hendel, and Michael D. Whinston. 2015. “Equilibria in Health Exchanges: Adverse Selection Versus Reclassification Risk.” Econometrica 83, no.4 (July): 1261–1313. https://doi.org/10.3982/ECTA12480.
Hendel, Igal and Alessandro Lizzeri. 2003. “The Role of Commitment in Dynamic Contracts: Evidence from Life Insurance.” The Quarterly Journal of Economics 118, no.1 (Feb): 299–328. https://doi.org/10.1162/00335530360535216.
Keys, Benjamin J. and Jialan Wang. 2019. “Minimum payments and debt paydown in consumer credit cards.” Journal of Financial Economics 131, no.3 (March): 528–548. https://doi.org/10.1016/j.jfineco.2018.09.009.
Rhodes, Andrew and Jidong Zhou. 2024. “Personalized Pricing and Competition.” American Economic Review 114, no.7 (July): 2141–2170. DOI: 10.1257/aer.20221524.