Summary
Around the world, air pollution is a major problem, and today’s large developing countries have perhaps the highest levels of air pollution recorded in human history. The World Health Organization sets an air quality standard for fine particulate matter which all 687 districts in India fail to meet. Air pollution beyond the WHO standard lowers the life expectancy of 1.3 billion Indian citizens by five years, on average.
The high level of pollution is a puzzle, given that firms in developing countries have access to the same pollution abatement technologies as firms in the United States, at least in principle. Manufacturing in the United States has become markedly cleaner over time while producing more output than ever.
A recent study investigates why pollution is so high in India, even though firms have access to abatement technologies. The researchers first used a randomized experiment to investigate the effects of more frequent inspections of plants. This lowered pollution only slightly, mainly among firms that would have been just above the legal limit. This result is surprising because the regulator sometimes penalizes firms harshly when they are shown to pollute.
To understand this more deeply, the researchers use a model linking the regulator’s choices and plant-level abatement decisions. The problem is not a lack of equipment: the regulator requires plants to install abatement equipment and compliance is high. If used, the abatement equipment would lower pollution sharply, yet the response to the higher chances of inspection is nevertheless limited.
The reason seems to be that the worst polluters were often on the radar screen of the regulator already. Extra inspections did not help the regulator to find more of the worst polluters, which are typically the ones that are penalized. Rather than increasing random inspections, the regulator could be given more resources and discretion over where to direct inspections.
There are two main avenues for reform: better information and better incentives. New technologies include Continuous Emissions Monitoring Systems (CEMS) which report pollution readings directly to the regulator over the internet or cell phone network. But since the regulatory regime combines approaches to monitoring and penalties, it must be considered as an integrated whole. Current regulations were designed in the context of existing monitoring. CEMS would change this context and may require changes in the legal framework.
With better information, the government could set incentives and impose penalties that were less harsh, but also more certain. Approaches could include a pollution tax on emissions or a system for trading emissions permits. Either could prompt more efficient choices of abatement across firms.
The research findings can be seen as good news. The gaps in current regulation suggest that reforms could lower pollution at relatively low cost. The answer is not “more” regulation, but “more precise” regulation. Firms could lower emissions, and there is political agreement that this would be desirable. Enforcement strategies that are alert to the incentives faced by firms could help to clear the air – and save lives.
Main article
Today’s large developing countries have perhaps the highest levels of air pollution recorded in human history. This column reports on an experiment to lower air pollution in India by improving regulation. The researchers find that more frequent inspections of plants would have only a modest effect on total pollution, but measures to improve information and incentives would be more effective. With better incentives for firms to use existing abatement equipment, air pollution could be reduced at relatively low cost, helping to save lives.
Today’s large developing countries have perhaps the highest levels of air pollution recorded in human history. The World Health Organization (WHO) sets an air quality standard of 10 micrograms per cubic meter for fine particles, PM2.5. In the United States, air pollution is worse than the WHO standard in 73 counties, home to 36 million people. In India, air pollution exceeds the same standard in all 687 districts, home to more than 1.3 billion people. The level of air pollution is so high that particulate matter air pollution above the WHO standard is estimated to reduce life expectancy by five life-years for an average Indian citizen (The Air Quality Life Index, 2020).
Why is pollution so high? Firms in developing countries, in principle, have access to the same pollution abatement technologies as firms in the United States. Industrial structure differs across countries, but developed nations retain some fossil-fuel power stations and polluting local industries like cement. Manufacturing in the United States has become markedly cleaner over time despite producing more output than ever (Shapiro and Walker, 2018).
Our recent paper argues that one part of the answer is that developing-country firms have access to technology but weak incentives to mitigate pollution (Duflo et al., 2018). In part, these weak incentives reflect the poor enforcement of existing regulations. The results show the difficulty of regulation in an environment with poor information and a limited set of regulatory tools. However, they also suggest that it is possible to control pollution at a low cost.
An experiment with inspections
Environmental regulation in India mainly follows a “command-and-control” approach. Firms are required to install certain pollution abatement equipment, and the government carries out inspections from time to time make sure that it is run. Whether firms actually do so will depend on how often they are inspected and the penalties they expect if the regulator uncovers high pollution. Our work looks inside this regulatory process, to see where it breaks down.
The regulatory agencies are understaffed and do not inspect firms often enough. We carried out an experiment to study the effects of more frequent inspections. In the experiment, a randomly-chosen group of plants saw the rate of inspection roughly double, bringing it closer to the statutory level. We compare pollution outcomes in this “treatment” group with those in a control group. This allows the effect of more frequent inspections on pollution to be estimated.
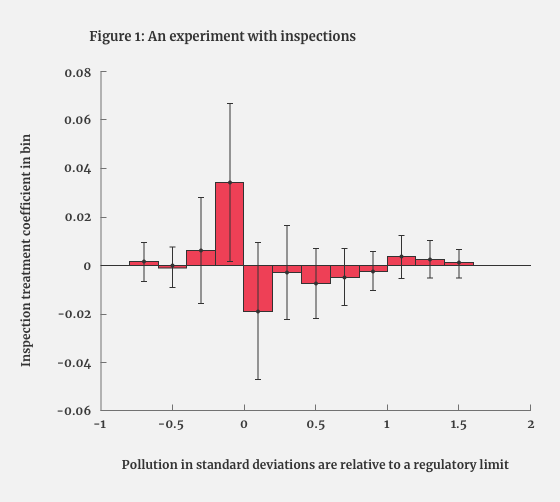
The large and randomized increase in inspections lowered total pollution only slightly. As Figure 1 shows, firms that would have been just above the legal limit were induced to shift their pollution to just below the limit, but there were not large reductions in pollution across the board.

Notes: This figure indicates that extra inspections lowered pollution mainly at firms just above the regulatory standard. The figure shows the coefficients from a series of regressions of indicators for pollution on treatment status. The dependent variables are indicator variables for pollution readings that fall in certain bins relative to the regulatory standard. These bins are normalized so that zero is a reading at the standard and pollution is measured in units of standard deviations relative to the standard. The independent variable is a dummy for assignment to the treatment that increased inspection frequency.
Why more frequent inspections are not enough
This result is surprising, since the regulator sometimes penalizes firms harshly when they are shown to pollute. It is therefore a paradox why a large increase in inspections, in the experiment, would not do more to bring pollution down.
We explain this apparent contradiction with a series of results that show just how difficult is the problem of environmental regulation. We estimate a model of plant abatement decisions, using the change in inspections in the experiment, to tie together our findings on inspections, penalties and pollution in the current regime. These are:
1. The problem is not a lack of equipment: the regulator requires plants to install abatement equipment, and we observe high compliance with this mandate.
2. The equipment is effective: we find that using the installed abatement equipment lowers pollution sharply.
3. Plants with especially high pollution are penalized by the regulator, and the penalties can be harsh. They can include shutting plants down, at least temporarily, when plants are a long way from meeting the regulatory standard.
4. More inspections – such as the random doubling in our experiment – do not induce many plants to use their abatement equipment, so overall pollution falls only modestly.
Here is where the paradox bites. If plants can lower pollution, and the regulator can penalize them for not doing so, then why would plants not abate when faced with so many more inspections?
5. Many of the most polluting plants were already on the regulator’s radar screen. Since the regulator penalizes only the worst polluters, an average plant—a plant chosen at random—will not be penalized, even if the regulator inspected it every day.
The value of regulatory discretion
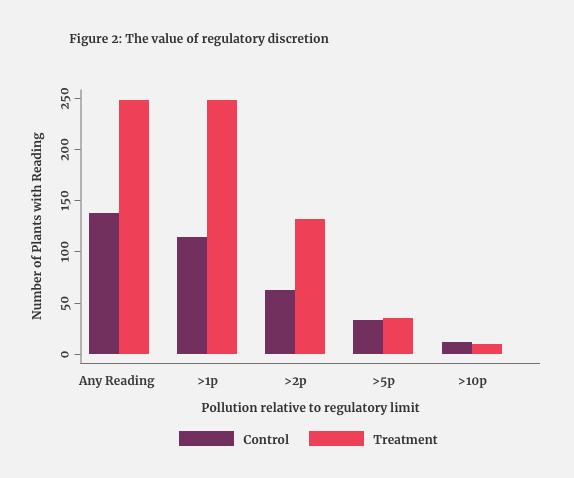
We show that additional random inspections, as in the experiment, did not help the regulator to find more of the worst polluters, since the regulator was already visiting these plants often (see Figure 2). This suggests that the regulator had some information about which firms might be polluting the most, and using that information is valuable.
In our experiment, the extra inspections were randomly assigned across plants. An alternative approach would give the regulator more resources and discretion over where to direct additional inspections. The regulator would be likely to target additional inspections at the subset of plants already on their watch list, and we forecast that that approach would reduce pollution by more than the random inspections studied in our experiment.

Notes: This figure indicates that extra inspections did not uncover more highly polluting plants than in the control group, suggesting that the regulator already had information about which these might be. The figure shows the number of plants found with pollution readings at increasing multiples of the regulatory standard, separately by treatment status. The main finding is that many more plants in the treatment group have pollution readings above once or twice the regulatory standard, but that the number of plants with readings above five or ten times the standard is the same in the control and treatment groups.
What does this look inside the regulatory process say about the scope for effective environmental regulation? The regulator’s targeted inspections do identify more heavily polluting plants than would random inspections. But the regulator does not see most of the pollution being emitted, most of the time. This is just not possible when a plant’s pollution for a whole year is estimated from a couple of spot checks that each last for thirty minutes or so.
Avenues for reform
We see two main avenues for reform: better information and better incentives.
The regulator could gather information on pollution that is more representative of annual emissions, perhaps using stronger environmental audits (Duflo et al., 2013). Another option would be to use new technologies such as Continuous Emissions Monitoring Systems, known as CEMS. These report pollution readings directly to the regulator over the internet or cell phone network. Three of us (Greenstone, Pande, and Ryan) and Anant Sudarshan have another experiment underway, to study this approach.
One likely challenge in the adoption of such technology is that the present regulatory regime is an integrated package of monitoring and penalties. Regulations that set limits on pollution are actually written with reference to the specific, in-person monitoring technology long in use, so it is unclear if regulators will be able to impose penalties if they find a firm that is very highly polluting on CEMS. Therefore, the use of CEMS technology may require a change in the legal framework for monitoring and penalties.
At the moment, penalties can be harsh, which may explain why they are rare. In effect, the regulator tries to deter speeding by impounding the car of one in a hundred people caught driving over the limit. This makes the likelihood of penalties remote and restricts them to only those driving 100 miles per hour.
With better information and measurement, the government could set incentives and impose penalties that were less harsh, but also steadier and more certain. These measures could include a pollution tax on emissions or a system for trading emissions permits. Either measure could lead to more efficient choices of abatement across firms and help the regulator to control the overall level of pollution.
Looking ahead
The findings from this research can be seen as good news. The gaps we have found in current regulation suggest that further experimentation and reforms could lower pollution at relatively low cost. The answer is not “more” regulation and draconian enforcement measures, but smarter, “more precise” regulation. Firms have the technical capacity to lower emissions. There is political agreement, embodied in the law, that this would be desirable. Enforcement strategies that are alert to the incentives faced by firms could help to clear the air.
This article summarizes ‘The value of regulatory discretion: Estimates from environmental inspections in India’ by Esther Duflo, Michael Greenstone, Rohini Pande and Nicholas Ryan, published in Econometrica in November 2018.


